Visit https://indiaelectiondata.in/legislative-election/ for detailed results.
The below pie chart shows the number of wons for each political party.

The below pie chart shows the number of wons for each political alliance.
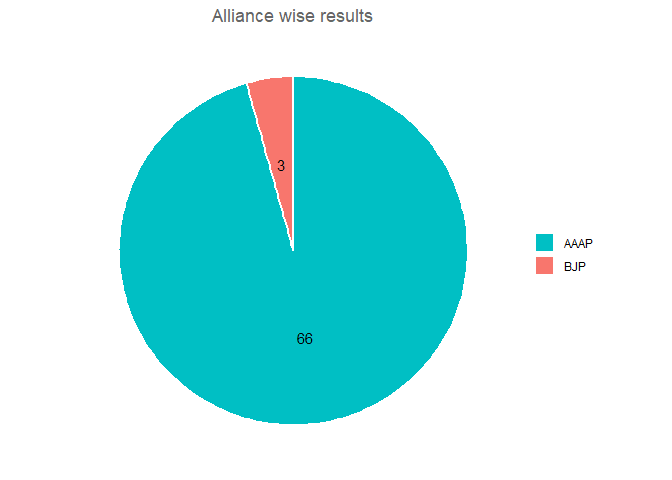
The 2015 election for NCT of Delhi legislative assembly had given a single majority stable government. The previous 2013 election resulted in a hung assembly. Aam Aadmi Party (AAAP) got a single majority with 66 seats. The detailed results are shown in the below tables & PI charts.
Out of 1.33 crore electors, the voter turns out was 0.9 crore, which is calculated to a polling percentage of 67.6%.
0.49 crore out of 0.9 crore voters has chosen AAAP, which is 110% more compared to the 2013 election.
0.29 crore voters have chosen BJP, which is 11% more compared to the 2013 election.
0.09 crore voters have chosen INC, which is 55.2% less compared to the 2013 election.
The data file in *.CSV format can be downloaded from Delhi 2015 Legislative Election
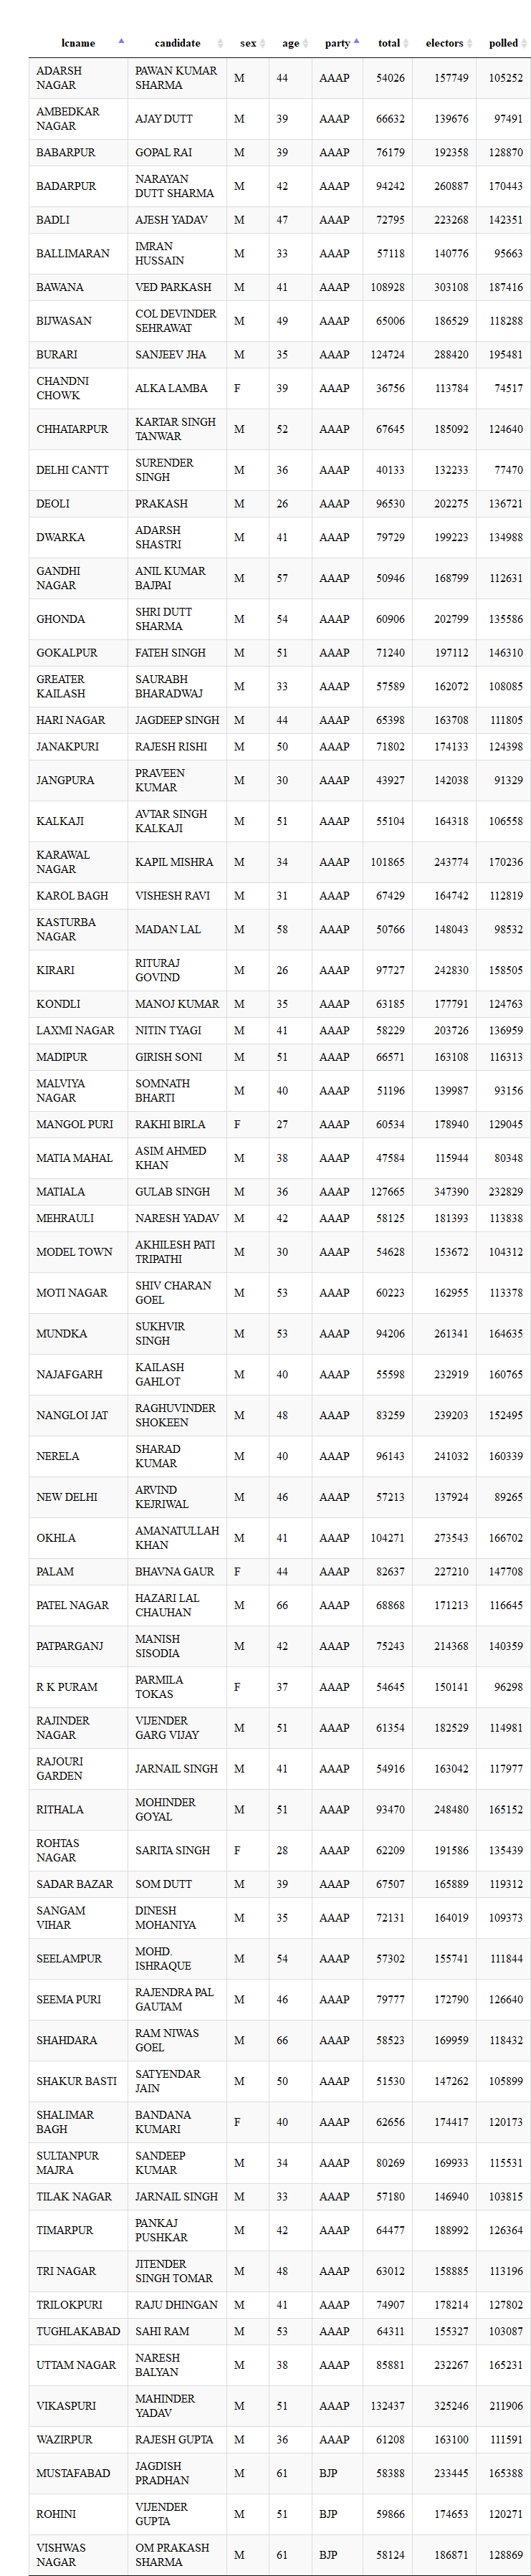
The below table shows the won candidate details for each legislative constituency. The values are first sorted by party name & then by constituency name.