

The below bar chart has the details of electors & voters for each election years.
- x-axis variable E-YOY (Election year on year)
- Y-axis variable Total Electors & Voters
Electors - Citizens who has eligibility to votes Voters - Electors who had casted their votes
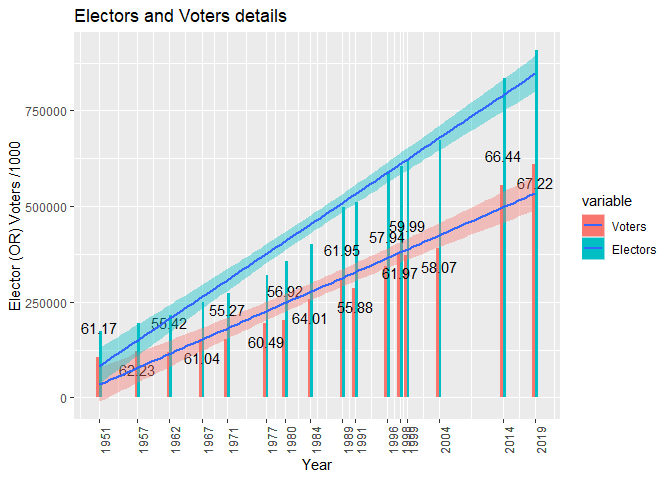
The values above each bar represents the polling percentage (Voters/Electors). And the line across the bar chart represents the linear model regression line.
As per the plot, on an average there is an increase of 13% (approximately) of electors for every election and the average polling percentage falls at 60%.
The data file in *.CSV format can be downloaded from Electors & Voters