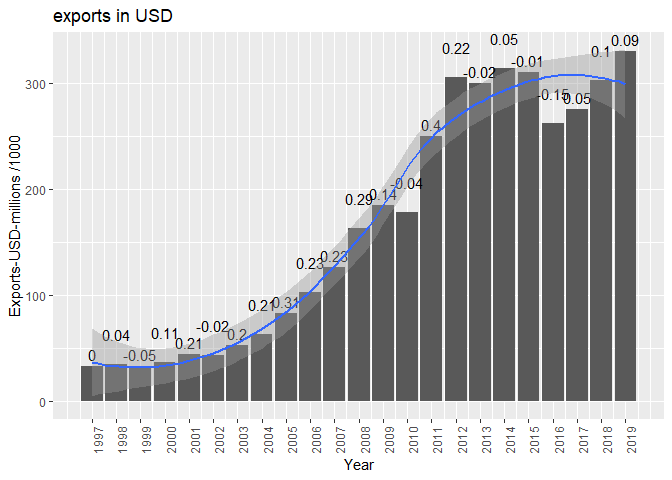
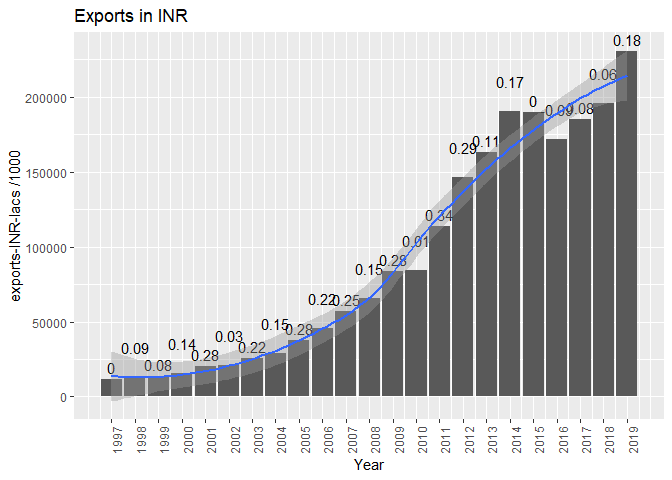
The below bar chart shows the details of Export values in USD & INR for each years.
- x-axis variable Year
- Y-axis variable Export value in USD millions / INR lacs
- The values above each bar indicates the %growth ((Current value - Previous value)/Previous values)
- The line across the bar chart is Smoothed conditional means
- Year - End of financial year - Example the year 1998 represents the financial year of 1997-98
For the year 2003 to 2014 the average INR value growth calculates to 20.5% & the average USD growth calculates to 18.5%.
The smoothed conditional mean line of INR shows a steady growth from 2013 to 2019 but for the same, USD shows a complete stagnation.
USD & INR value growth are completely opposite for some of the years and this is basically driven by fluctuations in USD & INR exchange rate.
As per the USD chart, We have reached close to 300K $million in 2011 and we are still fluctuating around it.