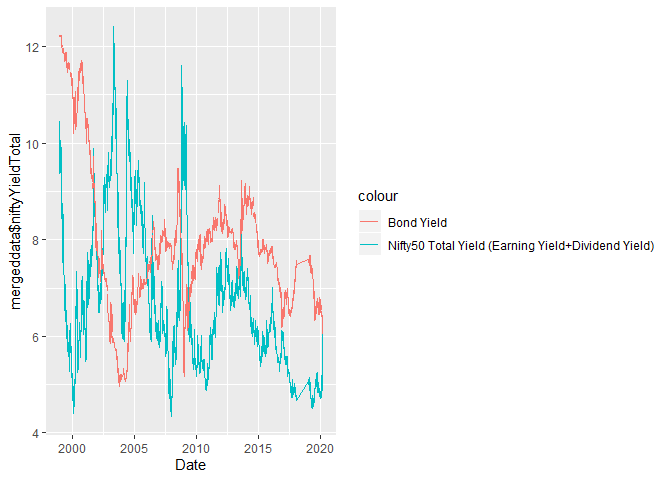
Nifty50 yield & 10-Years Bond yield
In the end, how your investment behave is much less important than how
you behave
— Benjamin Graham
The below line chart consist of
- X-axis variable: Date
- Y-axis variable: Nifty50 total yield (Dividen yield+Earning yield) & 10-Years Bond Yield (%)
Data source: Nifty50 Yield data -
https://www1.nseindia.com
10-Years Bond Yield data -
https://in.investing.com
Data taken from 1999 to 2020
Benjamin Graham stated that the defensive investor should have at least 25% of his portfolio on stock market and the percentage of stock market value should change based on bond yield and stock yield for both defensive investor and enterprising investor, which would justify an all-bond policy.
There is no set of definite rules, how an investment will behave, but all the investors supposed to buy equities at a lower price and sell them at a higher price, but most of them end up getting it reverse.

The above line chart shows the performance of 10-years bond yield in India and nifty50 total yiled. Nifty50 total yield is the sum of dividend yield & nifty50 stock earnings yield.
10-Year Bond yield = Coupen rate (OR) the interest earned from the bond
value
Nifty50 Total yield = Dividedn yield + Stock earning yield
Dividen yield = Dividend received / share price (%)
Stock earnings yield = EPS/share price (%)
EPS = Earnings/Share
Below are the conclusions from the above line chart
- The Nifty50 yield is higher than Bond yield for the below periods
- Few days in 2001
- Most of the days in the second half of the year 2002
- Most of the days in December 2003
- Most of the days in the 1st quarter and last quarter of 2004
- Few days in the first half and most of the days in the second half of 2005
- Few days in 1st & 6th month of 2006
- Few days in 10th & 11th month of 2008
- few days in 4th & 5th month of 2009
- Except for the above mentioned periods, Nifty50 yield is always lesser than 10-years bond yield
- Out of 5036 days, the Nifty50 yield is higher than the bond yield for only 1033 days.
## [1] 1033
- Below are the minimum, maximum, mean & median data of ratio (Nifty50 yield / 10-Years bond yield)
| Min. | 1st Qu. | Median | Mean | 3rd Qu. | Max. | NA’s |
|---|---|---|---|---|---|---|
| 0.4160 | 0.7194 | 0.7979 | 0.8925 | 0.9394 | 2.0966 | 142 |
The data file in *.CSV format can be downloaded from Nifty50 Yield from 1999 to 2020 & 10-years Bond Yield
