Data Source: https://www.who.int/
Date downloaded: 05-Apr-2020
Situation report 1 (21-Jan-2020) to 75 (04-Apr-2020)
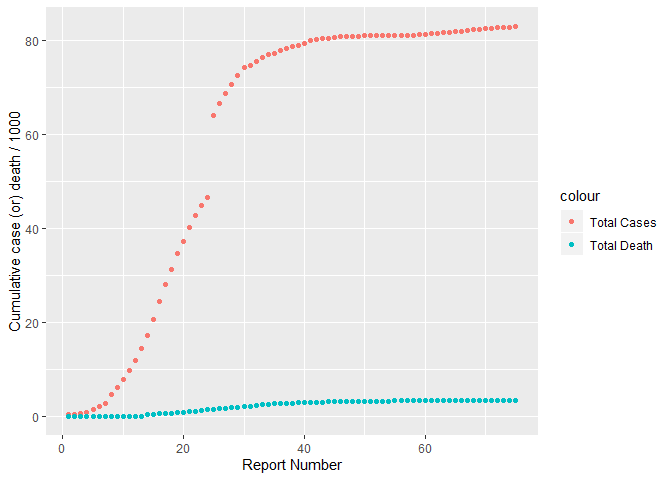
China total cases as on date: 82802 (World-1051635)
China total deaths as on date: 3331 (World-56985)
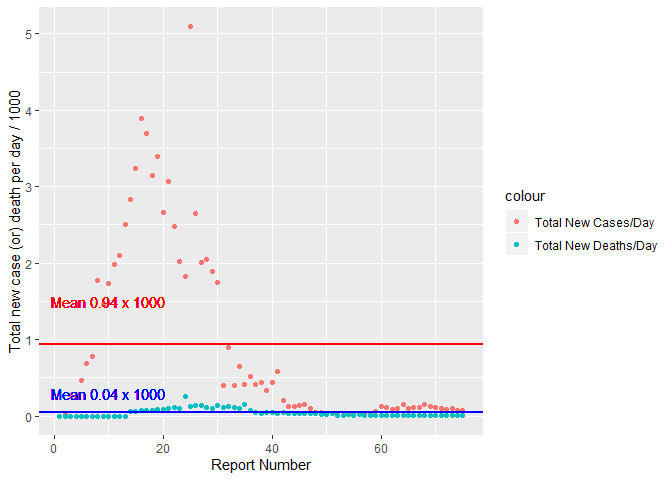
China daily average new cases: 950 (World-13863) - Current values are far less than the average.
China daily average new deaths: 40 (World-756) - Current values are far less than the average.
Exponential Growth constant ‘k’ for total cases: 0.17/day (World-0.18/day) - Current values are far less than the average.
Exponential Growth constant ‘k’ for total deaths: 0.03/day (World-0.04/day) - Current values are less than the average.
The below chart has
- x-axis - Report number (OR) Day number (Report number 1 starts on 21-Jan-2020)
- y-axis - cumulative total death & total cases as of reported date
The below graph clearly shows that the Covid-19 spread was initially exponential and later it started following logarithmic.
The below chart has
- x-axis - Report number (OR) Day number (Report number 1 starts on 21-Jan-2020)
- y-axis - Daily reported new deaths & cases
The below graph clearly shows that the Covid-19 daily new spread was controlled extensively.

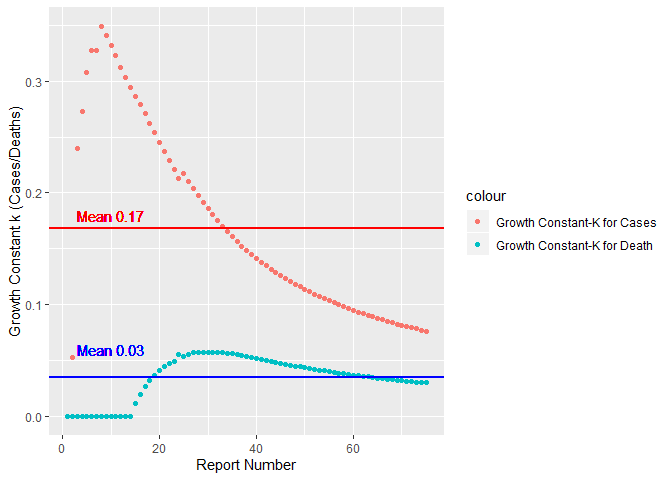
The below chart has
- x-axis - Report number (OR) Day number (Report number 1 starts on 21-Jan-2020)
- y-axis - Growth constant (K) for cases / deaths
Growth constant is calculated from the below general growth/decaying formula
A=Pekt
The growth constant for cases is decaying and the current values are
less than the average.
The growth constant for deaths is decaying and
the current values are less than the average.
The summary of growth constant k for total cases
| Min. | 1st Qu. | Median | Mean | 3rd Qu. | Max. |
|---|---|---|---|---|---|
| 0.0000 | 0.09704 | 0.14136 | 0.16834 | 0.23287 | 0.34905 |
The summary of growth constant k for total deaths
| Min. | 1st Qu. | Median | Mean | 3rd Qu. | Max. |
|---|---|---|---|---|---|
| 0.0000 | 0.03023 | 0.03845 | 0.03468 | 0.04936 | 0.05717 |