
Centrism Parties of India
AIADMK, INLD, JD(S) & NPP are the major centrism parties of India
Image by www.thoughtcatalog.com
by theDataTalks
17 Feb 2019
Read more
Constitution of India
15th August 1947, India became independent and the “Constitution of India” (BhāratīyaSaṃvidhāna) was adapted by Constituent assembly of India on 26th Nov 1949. The Constitution of India became effective on 26th Jan 1950, it was the day Dominion of India became
Photo by Mikhail Pavstyuk on Unsplash
by theDataTalks
17 Feb 2019
Read more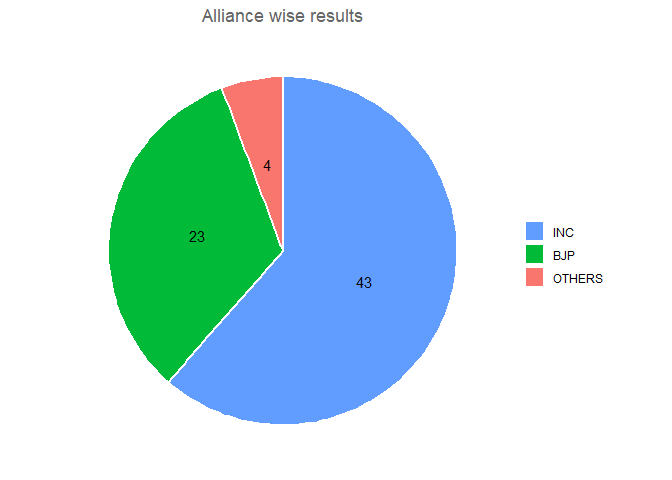
Delhi 2008 legislative election - state alliances, vote share, seats won and key events
The 2008 election for NCT of Delhi legislative assembly had given a single majority stable government. Sheila Dikshit from INC was elected for the third time and she became the longest-serving female
Image is a Pie chart and it shows the number of wons by various alliances in the state.
by theDataTalks
19 Aug 2020
Read more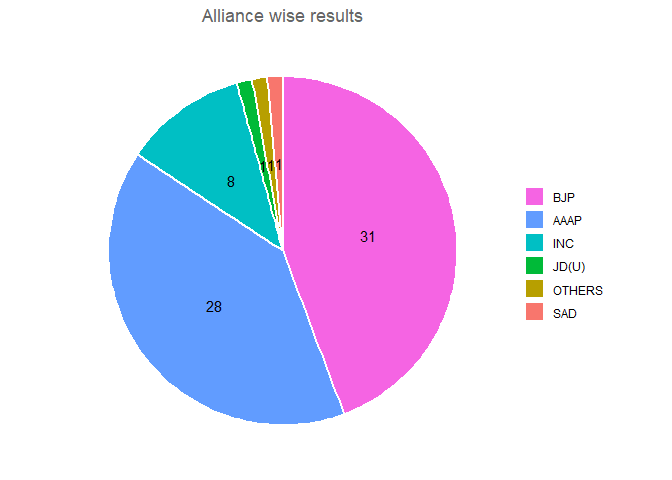
Delhi 2013 legislative election - state alliances, vote share, seats won and key events
2013 election for NCT of Delhi legislative assembly had given a hung assembly. Bharatiya Janata Party (BJP) got 31 seats, but they failed to prove its majority. It was the first election for Aam Aadmi Party (AAAP) and
Image is a Pie chart and it shows the number of wons by various alliances in the state.
by theDataTalks
19 Aug 2020
Read more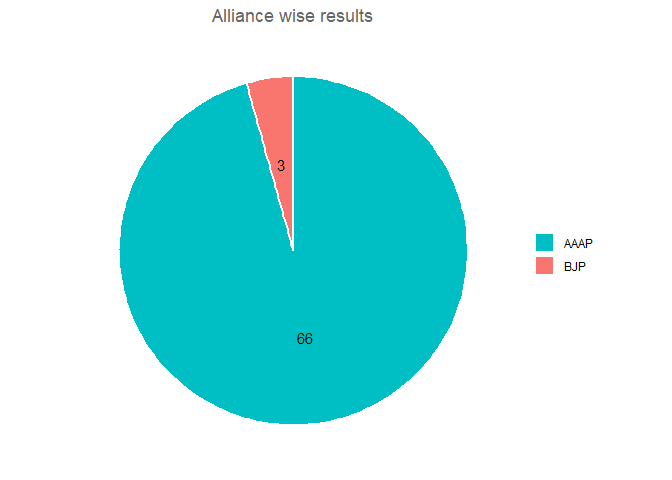
Delhi 2015 legislative election - state alliances, vote share, seats won and key events
The 2015 election for NCT of Delhi legislative assembly had given a single majority stable government. The previous 2013 election resulted in a hung assembly. Aam Aadmi Party (AAAP) got a single majority with
Image is a Pie chart and it shows the number of wons by various alliances in the state.
by theDataTalks
19 Aug 2020
Read more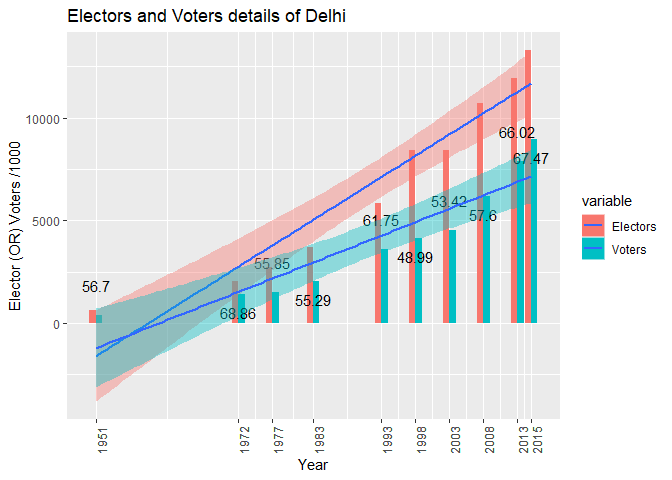
Delhi electors and voters details
As per the bar chart, the average increase in electors is calculated to 27% E-YoY (approximately), which is approximately 14% higher growth when compared to India's average elector's growth of 13%. The average polling percentage for NCT of Delhi falls at 59.5%, which is approximately **0.5%** lower when compared to
Image is a Bar chart and it shows the total number of electors & voters for each election years of Delhi
by theDataTalks
17 Feb 2019
Read more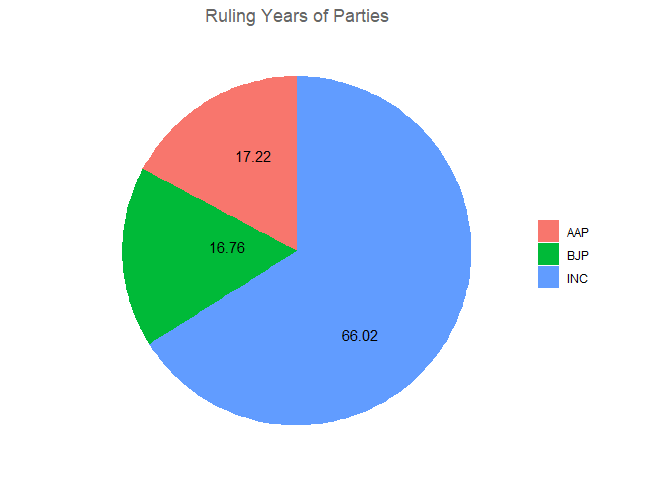
Over view of NCT of Delhi legislative results - Ruling years of various parties and Legislative constituency details
Unlike other Indian states/union territories, Delhi was not having the same status from 1951. In 1951 Delhi was a Part-C state and **"Chaudhary Brahm Prakash"** became the first chief minister of Delhi. In 1956, it was made as a Union territory under the direct control of
Image is a Pie chart and it shows the percentage ruling years of various parties
by theDataTalks
17 Feb 2019
Read more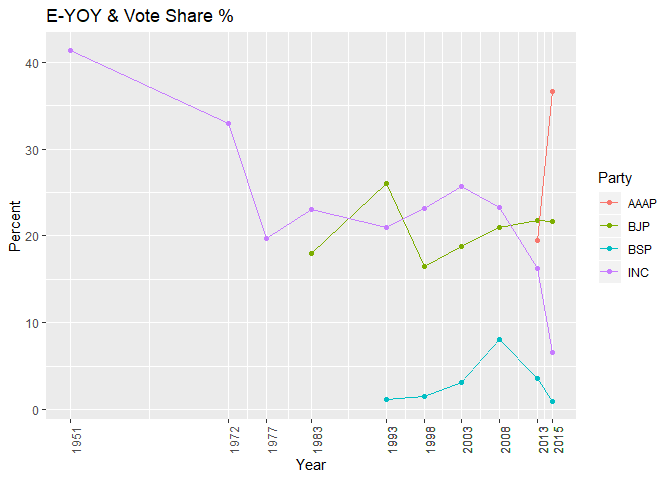
Legislative assembly - NCT of Delhi - Vote share of major political parties and Election Year growth
The below bar chart is a comparison of Vote bank for four major parties in Delhi viz., Indian National Congress (INC), Bharatiya Janata Party (BJP), Bahujan Samaj
Image is a Line chart and it shows the percentage vote share of major political parties in NCT of Delhi
by theDataTalks
17 Feb 2019
Read more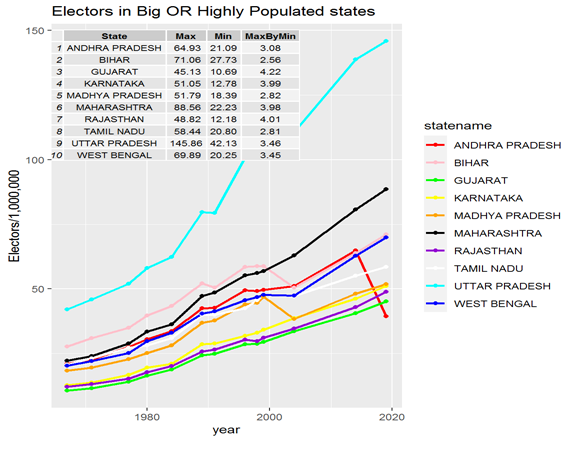
Electors of Indian States
Measure the increase or decrease in electors count for various states; Measure the change in voters count or polling percentage; Comparing electors growth between various states of India.
Image is a Line chart and it shows the electors details for various important states in India
by theDataTalks
24 Feb 2021
Read more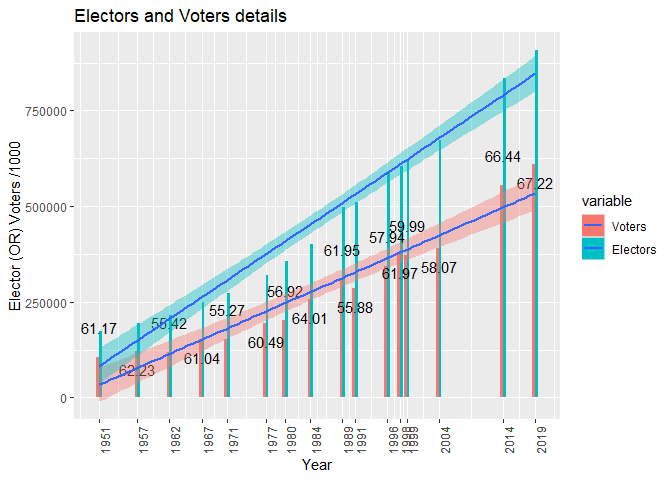
Parliamentary election - Electors and Voters details for each election years
As per the plot, on an average there is an increase of 13% (approximately) of electors for every election and the average polling percentage
Image is a Bar chart and it shows the total number of electors & voters for each election years
by theDataTalks
17 Feb 2019
Read more
Major milestones of Indian National Congress (INC)
**1885:** Founded by Allan Octavian Hume, Dadabhai Naoroji, Dinshaw Wacha & Womesh Chunder Bonnerjee **1905:** Gopala Krishna Gokhale elected as President of INC
INC party flag
by theDataTalks
17 Feb 2019
Read more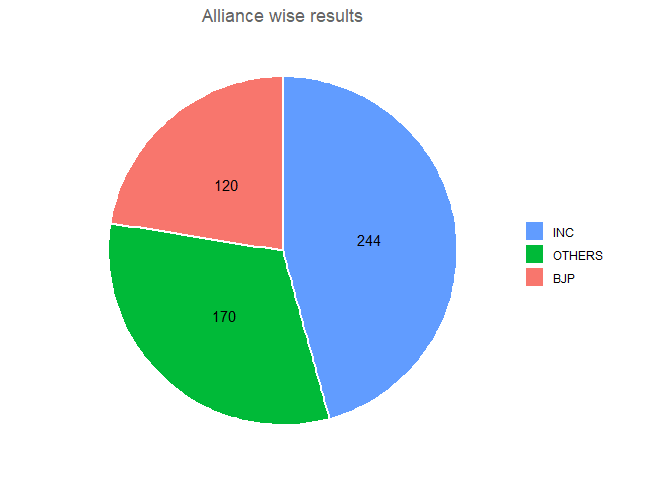
India 1991 Parliamentary election - National alliances, vote share, seats won and key events.
The government formed after 1989 parliamentary election got dissolved within 18 months and the next election was held in 1991. Due to insurgency, the voting in the state of Jammu & Kashmir was not held and due to
Image is a Pie chart and it shows the number of wons by various alliances in the state.
by theDataTalks
29 Aug 2020
Read more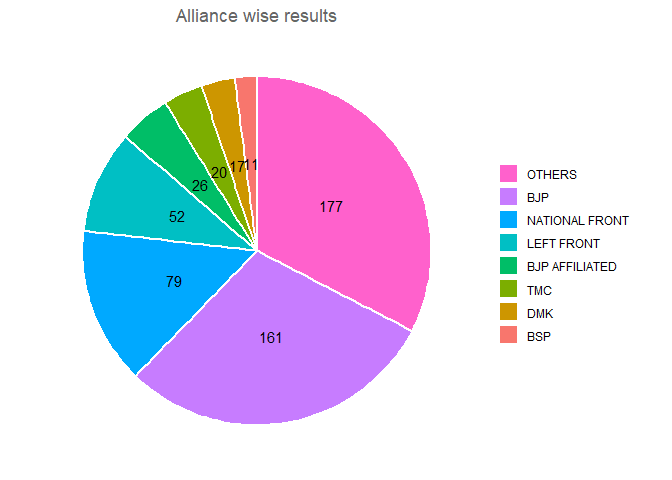
India 1996 Parliamentary election - National alliances, vote share, seats won and key events.
1996 election resulted in a hung parliament and none of the leading parties/pre-poll alliances were able to prove their single majority. The below alliance table has the complete details of pre-poll alliances. After the election, a new third front was formed by
Image is a Pie chart and it shows the number of wons by various alliances in the state.
by theDataTalks
29 Aug 2020
Read more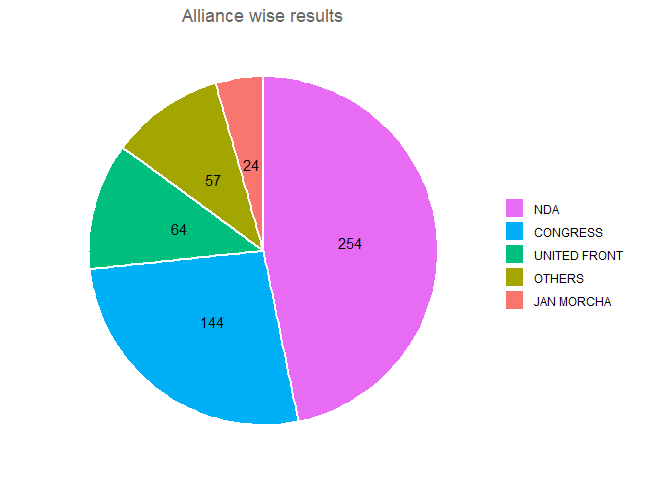
India 1998 Parliamentary election - National alliances, vote share, seats won and key events.
National alliances, vote share, seats won and key events.
Image is a Pie chart and it shows the number of wons by various alliances in the state.
by theDataTalks
29 Aug 2020
Read more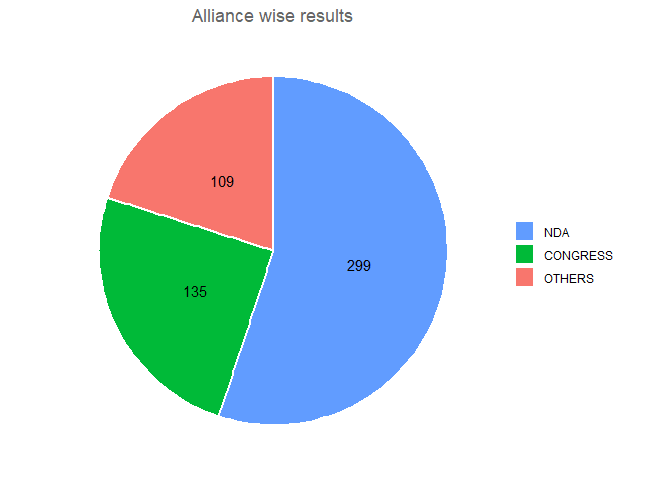
India 1999 Parliamentary election - National alliances, vote share, seats won and key events.
National alliances, vote share, seats won and key events.
Image is a Pie chart and it shows the number of wons by various alliances in the state.
by theDataTalks
29 Aug 2020
Read more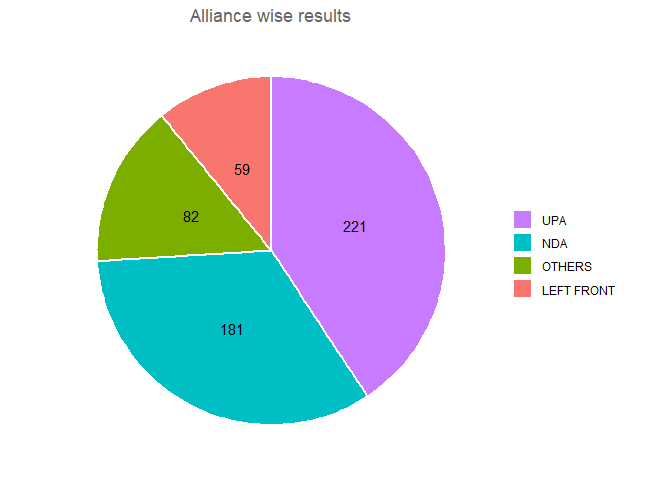
India 2004 Parliamentary election - National alliances, vote share, seats won and key events.
National alliances, vote share, seats won and key events.
Image is a Pie chart and it shows the number of wons by various alliances in the state.
by theDataTalks
29 Aug 2020
Read more
India 2009 Parliamentary election - National alliances, vote share, seats won and key events.
National alliances, vote share, seats won and key events.
Image is a Pie chart and it shows the number of wons by various alliances in the state.
by theDataTalks
29 Aug 2020
Read more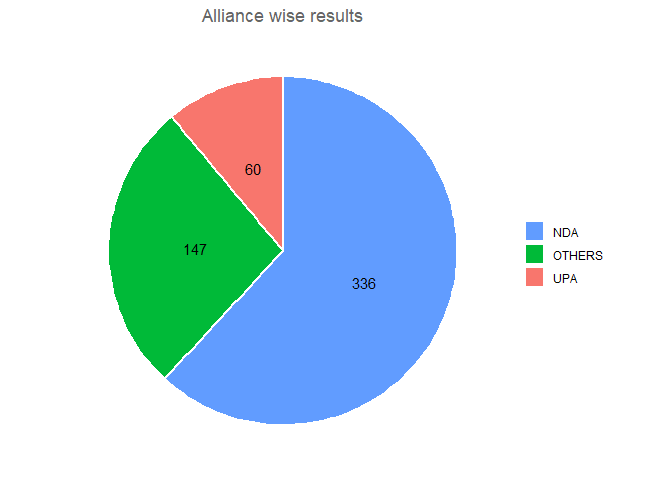
India 2014 Parliamentary election - National alliances, vote share, seats won and key events.
National alliances, vote share, seats won and key events.
Image is a Pie chart and it shows the number of wons by various alliances in the state.
by theDataTalks
29 Aug 2020
Read more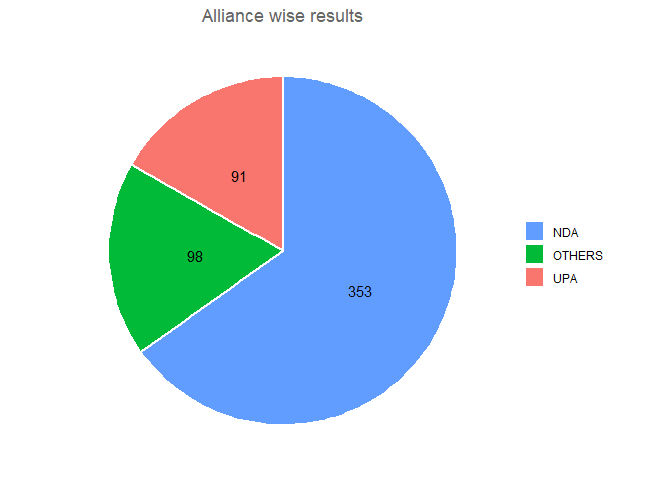
India 2019 Parliamentary election - National alliances, vote share, seats won and key events.
2019 general election is the 17th Lok Sabha election for India. This election resulted in a single strong majority government established by Bharatiya Janata Party (BJP), under the leadership of Narendra Modi. The detailed results are shown in the below tables &
Image is a Pie chart and it shows the number of wons by various alliances in the state.
by theDataTalks
29 Aug 2020
Read more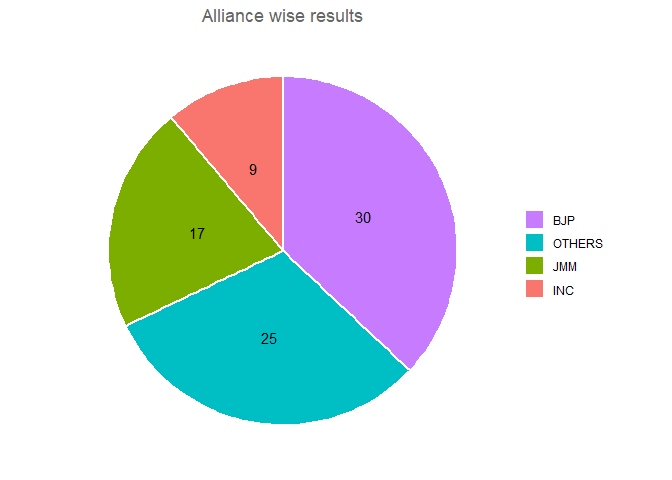
Jharkhand 2005 legislative election - state alliances, vote share, seats won and key events.
2005 election is the first election for the second legislative assembly. The previous assembly was formed based on Bihar state assembly election for the year 2000. The 2005election for Jharkhand legislative assembly had
Image is a Pie chart and it shows the number of wons by various alliances in the state.
by theDataTalks
19 Aug 2020
Read more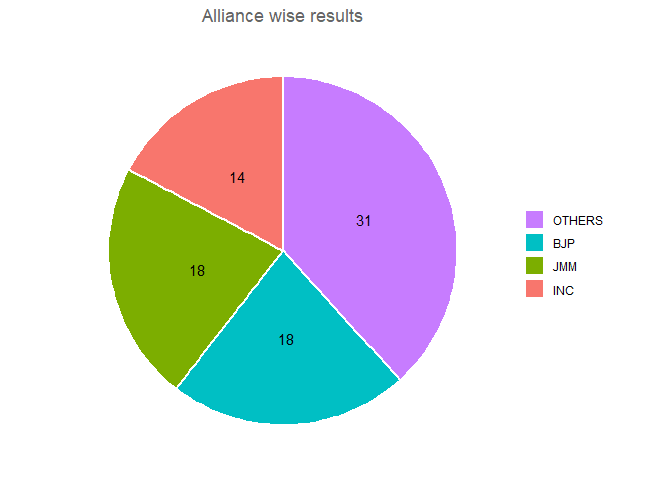
Jharkhand 2009 legislative election - state alliances, vote share, seats won and key events.
The 2009 election for Jharkhand legislative assembly had given a hung assembly similar to all previous elections. The detailed results are shown in the below tables & PI charts. The state was under President’s rule
Image is a Pie chart and it shows the number of wons by various alliances in the state.
by theDataTalks
19 Aug 2020
Read more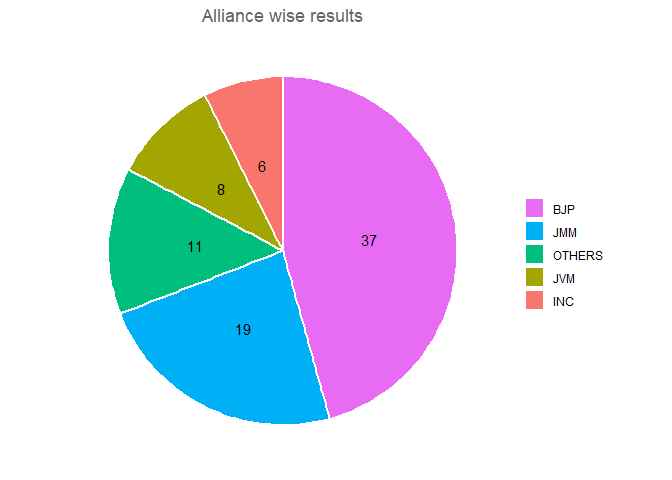
Jharkhand 2014 legislative election - state alliances, vote share, seats won and key events.
The 2014 election for Jharkhand legislative assembly had given a stable government for the first time. All previous elections resulted in a hung assembly. Bharatiya Janata Party (BJP) got a single majority with
Image is a Pie chart and it shows the number of wons by various alliances in the state.
by theDataTalks
19 Aug 2020
Read more
Leftism Parties of India
Left-wing again split into three subgroups, viz., left-wing, center left-wing & far left-wing parties. The below tables shows the list of parties for each sub-division.
Photo by 🇨🇭 Claudio Schwarz | @purzlbaum on Unsplash
by theDataTalks
17 Feb 2019
Read more
Major milestones of Bharatiya Janata Party (BJP)
**1951 - 1977:** BJP is preceded by Bharatiya Jana Sangh (BJS). **1977 - 1980:** BJP is preceded by Janata Party (JNP). **Formation of Janata Party (JNP):** **1972:** Samyukta Socialist Party (SSP) merged with PSP
BJP party flag
by theDataTalks
17 Feb 2019
Read more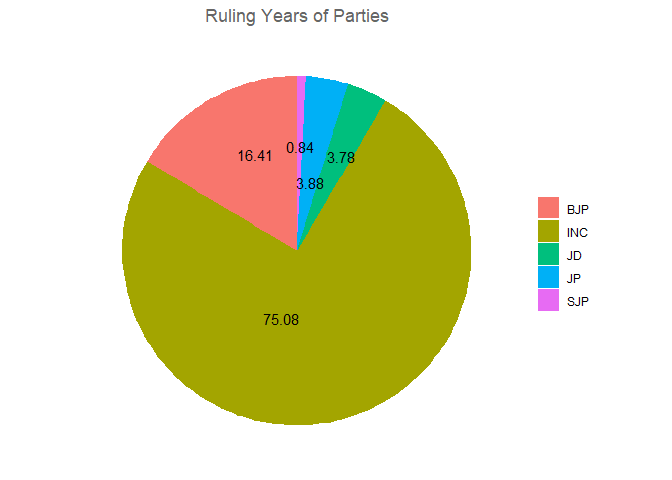
Over View of Indian Parliamentary results - Summary of ruling years of various political parties in India & list of prime ministers of India.
India had 17 Parliamentary elections (Lok Sabha) & 17 Prime ministers till 2019. Below is the summary of the total ruling periods of each party to date. **Indian National Congress** (INC - a Centre Left-Wing Party of India) have ruled India for almost 54.4 years
Image is a Pie chart and it shows the percentage ruling years of Indian parties from 1947 to 2019
by theDataTalks
17 Feb 2019
Read more
Major Political Alliances formed in India during various elections after independence until 2019
**UPA (Centre-Left Alliance of India)**, **NDA (Centre-Right Alliance of India)**, **Left Front (West Bengal)**, **North-Eastern Democratic Alliance (NEDA)**, **Janata Parivar Alliance**, **Mahagathbandhan Alliance**, **Third Front**
Photo by Jessica Sysengrath on Unsplash
by theDataTalks
17 Feb 2019
Read more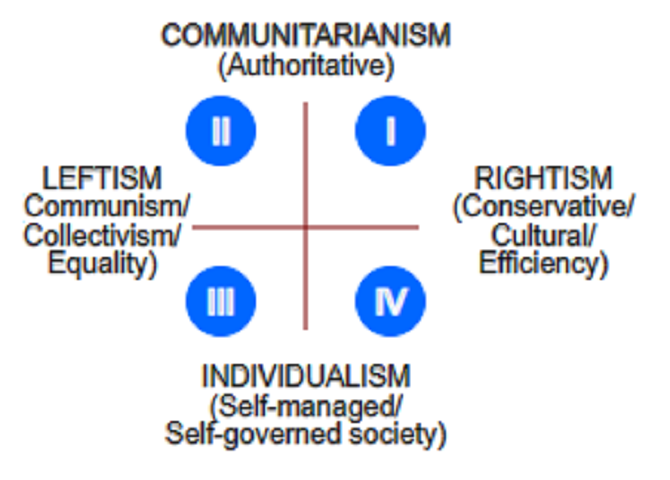
Political Spectrum
The political term Left & Right refers to the 17th-century seating arrangement in the French Estates-General. The people who sat on the left side opposed the monarchy and supported secularism & the people who sat on the right side were supportive of the traditional institutions. The use of the term “Left” become more
Image is a representation of simple four quandrant political spectrum
by theDataTalks
17 Feb 2019
Read more
Rightism Parties of India
Right-wing again split into three subgroups, viz., right-wing, center right-wing & far right-wing parties. The below tables shows the list of parties for each sub-division.
Photo by Nick Fewings Unsplash
by theDataTalks
17 Feb 2019
Read more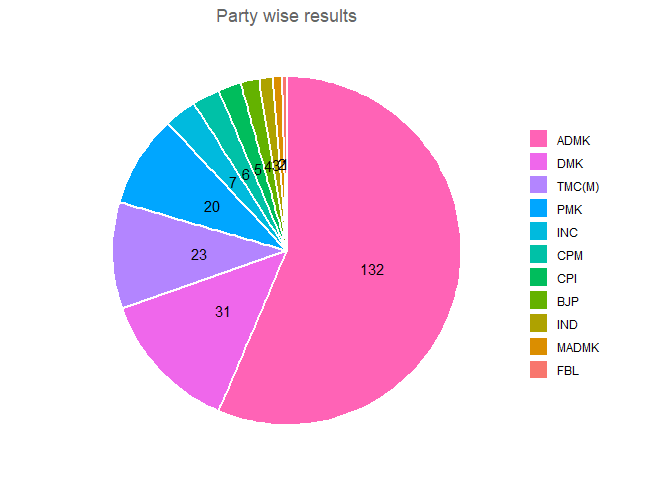
Tamil nadu 2001 legislative election - state alliances, vote share, seats won and key events.
2001 legislative election - state alliances, vote share, seats won and key events.
Image is a Pie chart and it shows the number of wons by various alliances in the state.
by theDataTalks
19 Aug 2020
Read more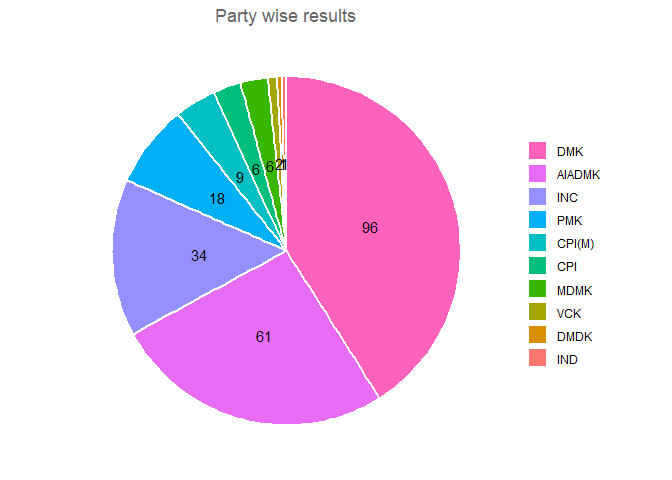
Tamil nadu 2006 legislative election - state alliances, vote share, seats won and key events.
2006 legislative election - state alliances, vote share, seats won and key events.
Image is a Pie chart and it shows the number of wons by various alliances in the state.
by theDataTalks
19 Aug 2020
Read more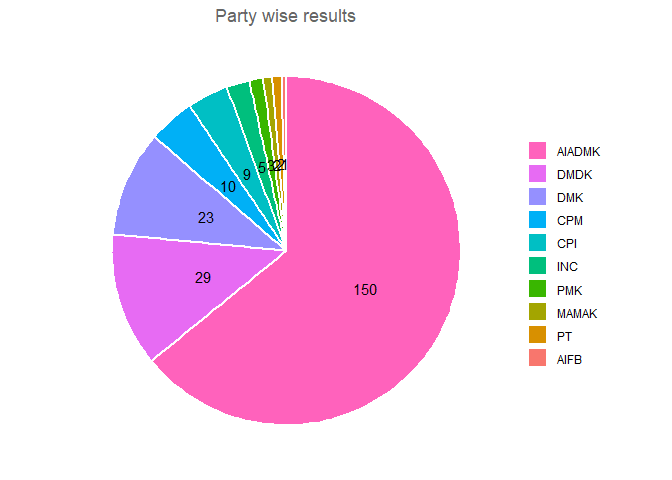
Tamil nadu 2011 legislative election - state alliances, vote share, seats won and key events.
2011 legislative election - state alliances, vote share, seats won and key events.
Image is a Pie chart and it shows the number of wons by various alliances in the state.
by theDataTalks
19 Aug 2020
Read more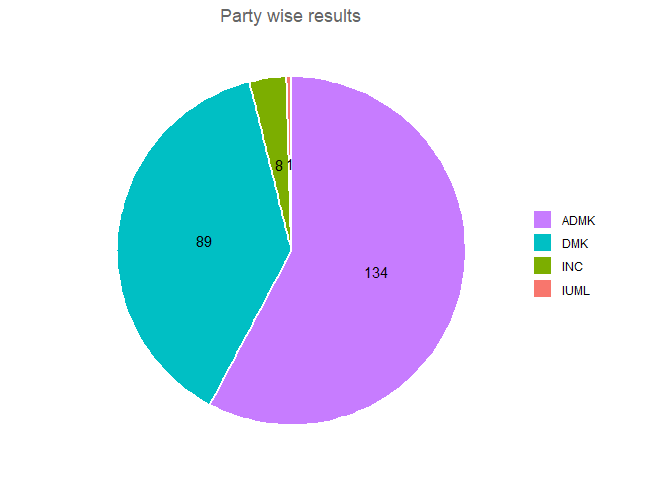
Tamil nadu 2016 legislative election - state alliances, vote share, seats won and key events.
2016 election for Tamil Nadu legislative assembly had given a single majority stable government and it was notable in many ways - This was the first time after 1984 for AIADMK and J. Jayalalithaa to be re-elected. - AIADMK contested in the highest number of constituencies 227. - All 234 constituencies were contested by AIADMK allies in the party symbol.
Image is a Pie chart and it shows the number of wons by various alliances in the state.
by theDataTalks
19 Aug 2020
Read more
Tamil Nadu electers and voters details for each election years
If you look at the bar chart **(Electors/Voters)**, the average increase in electors is calculated to **9.85% E-YoY (approximately),** which is approximately **3.5%** lesser growth when compared to **India's average elector's growth of 13%**. The average polling percentage of Tamil Nadu falls at **67%**, which is approximately **7%**
Image is a Bar chart and it shows the electors & voters details
by theDataTalks
31 Dec 2019
Read more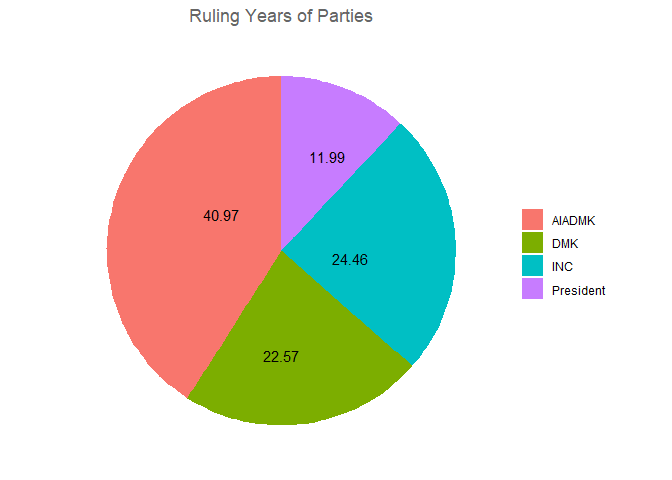
Over View of Tamil Nadu Legislative election results - Ruling years of various parties and number of legislative constituency details
1967 is the end of national parties in the state of Tamil Nadu (TN) and the state party **Dravida Munnetra Kazhagam (DMK)** won the election and started ruling TN. From 1967, national parties never get a majority chance to rule the state. DMK or **AIADMK (All India Anna Dravida Munnetra Kazhagam)** are the two major
Image is a Pie chart and it shows the percentage of ruling years of various parties
by theDataTalks
31 Dec 2019
Read more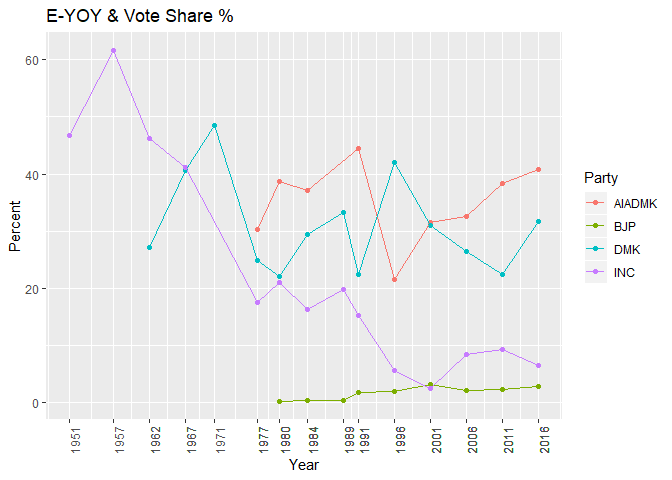
Legislative assembly - Tamil Nadu - Vote share of major political parties and election year growth
The two major state parties AIADMK (All India Anna Dravida Munnetra Kazhagam) & DMK (Dravida Munnetra Kazhagam) and the two national parties INC (Indian National Congress) and BJP (Bharatiya Janata Party) are taken into consideration in the **"Vote share"/"Vote bank"** line chart of Tamil Nadu. Apart from the above four parties, **Pattali Makkal Katchi (PMK)**
Image is a Line chart and it shows the percentage vote share of major political parties
by theDataTalks
17 Feb 2019
Read more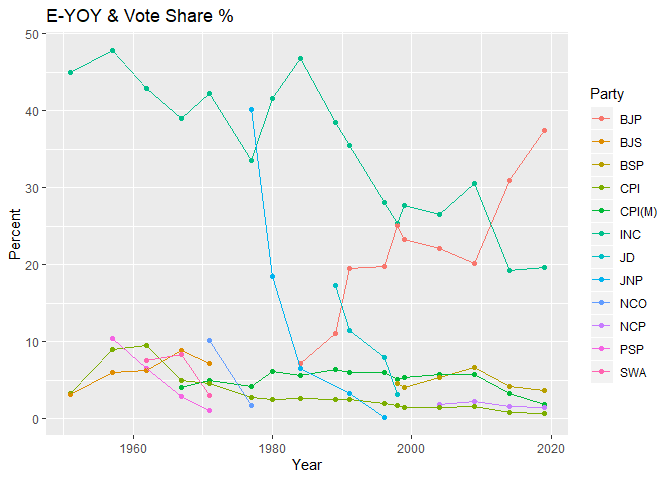
Vote share and growth of national parties - The vote share of major political parties and E-YOY (Election - Year on Year) growth.
In 1984, INC has got 12.01 crore votes, which is the highest they have ever got until 2019. From 1984 to 1998, the vote bank of INC was decreasing up to 9.5 crores and it started to increase from 1999 till 2019, but there is no
Image is a Line chart and it shows the percentage vote share of major political parties for E-YOY.
by theDataTalks
17 Feb 2019
Read more