

The below bar chart has the details of electors & voters for each election years.
- x-axis variable E-YOY (Election year on year)
- Y-axis variable Total Electors & Voters
Electors - Citizens who has eligibility to votes
Voters - Electors who had casted their votes
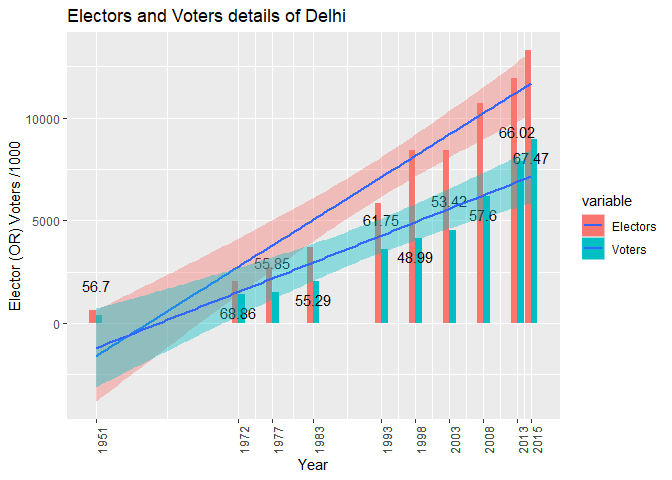
The values above each bar represent the polling percentage (Voters/Electors). And the line across the bar chart represents the linear model regression line.
As per the bar chart, the average increase in electors is calculated to 27% E-YoY (approximately), which is approximately 14% higher growth when compared to India’s average elector’s growth of 13%.
The average polling percentage for NCT of Delhi falls at 59.5%, which is approximately 0.5% lower when compared to India’s average polling percentage of 60%.
The above mentioned average values are calculated without considering 1951 data since there was a major change in the elector’s data from 1951 to 1972.
The total voters in the bar chart for the year 1951 were back-calculated from reported polling percentage, since NCT of Delhi had dual member & single-member constituencies.
1972, 1977 & 1983 election details are from Delhi metropolitan council election.
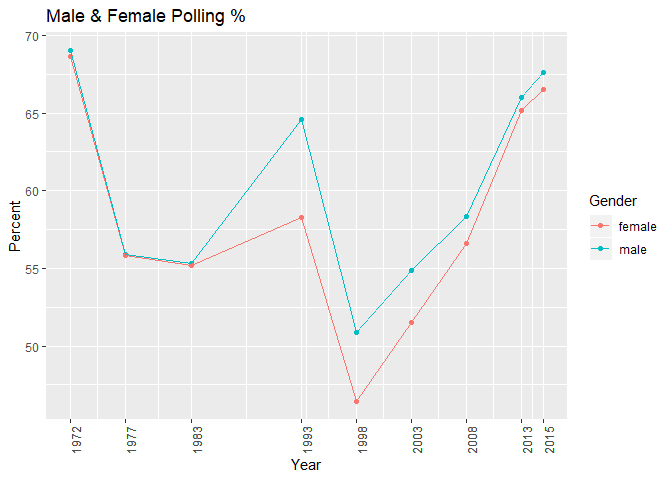
Male & Female voters:
1951 male/female voting values are not available; hence we have taken data from the year 1972. The below line chart clearly shows that the male & female voting percentage is travelling parallel to each other. Always female voting percentage is slightly lesser than the male voting percentage.
The average percentage of male voters is calculated to 60.29%, which is just 0.29% higher when compared to India’s average polling percentage of 60%. The average percentage of female voters is calculated to 58.23%, which is 1.77% lower when compared to India’s average polling percentage of 60%.
The data file in *.CSV format can be downloaded from Electors & Voters of Delhi & Male, Female Voters