Tamil nadu 2016 legislative election - state alliances, vote share, seats won and key events.
Visit https://indiaelectiondata.in/legislative-election/ for detailed results.
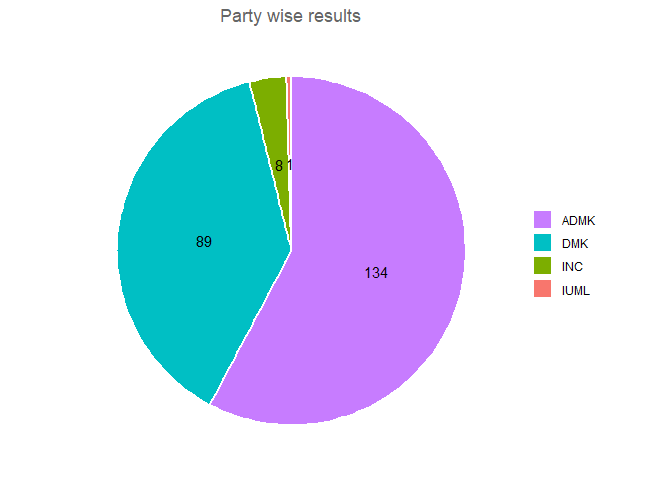
The below pie chart shows the number of wons for each political party.

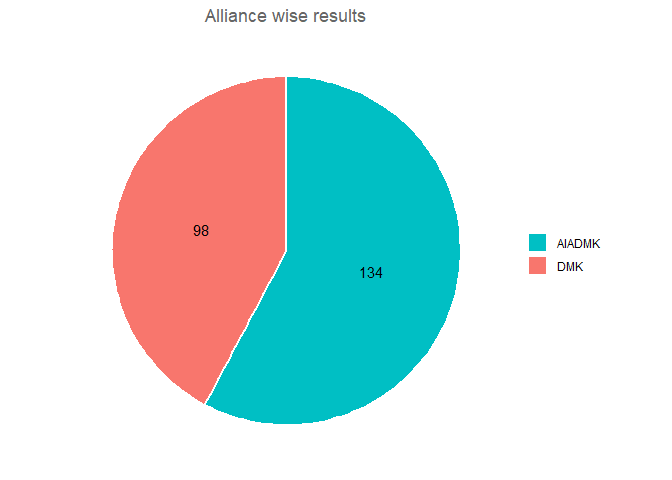
The below pie chart shows the number of wons for each political alliance.

2016 election for Tamil Nadu legislative assembly had given a single majority stable government and it was notable in many ways
- This was the first time after 1984 for AIADMK and J. Jayalalithaa to be re-elected.
- AIADMK contested in the highest number of constituencies 227.
- All 234 constituencies were contested by AIADMK allies in the party symbol.
- Third front Makkal Munnetra Kazhagam (MMK) was formed and it was lead by Vijayakanth.
- Pattali Makkal Katchi (PMK) & Naam Tamilar Katchi (NTK) contested in 232 & 231 constituencies as single parties without any alliances.
- DMK vote bank had grown by 65.7% and at the same time, AIADMK had grown 24.5% compared to the previous election.
- J.Jayalalithaa & M.Karunanidhi who had been ill for a long time, died in the months following the election.
- It was a competition between DMK & AIADMK and none of the other coalition parties were able to prove thier vote bank.
Out of 5.78 crore electors, the voter turn out was 4.32 crore, which is calculated to a polling percentage of 74.74%.
1.76 crore out of 4.32 crore voters has chosen AIADMK, which is 24.5% more compared to the 2011 election.
1.37 crore voters have chosen DMK, which is 65.7% more compared to 2011 election.
0.27 crore voters have chosen INC, which is 19.0% less compared to 2011 election.
0.12 crore voters have chosen BJP, which is 49.9% more compared to 2011 election.
The data file in *.CSV format can be downloaded from Tamil Nadu 2016 Legislative Election
The below table shows the won candidate details for each legislative constituency. The values are first sorted by party name & then by constituency name.

