India 2019 Parliamentary election - National alliances, vote share, seats won and key events.
by theDataTalks . 29 Aug 2020Visit https://indiaelectiondata.in/ for detailed results.
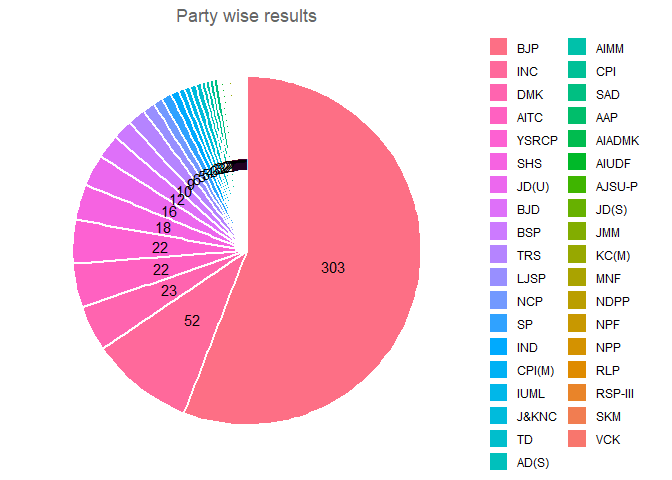
The below pie chart shows the number of wons for each political party.
The below pie chart shows the number of wons for each political alliance.

2019 general election is the 17th Lok Sabha election for India.
This election resulted in a single strong majority government established by Bharatiya Janata Party (BJP), under the leadership of Narendra Modi. The detailed results are shown in the below tables & above PI charts.
There were four major alliances NDA, UPA, Left front & Mahagathbandhan contested in this election.
Out of 90.87 crore electors, the voter turns out was 61.08 crores, which is calculated to a polling percentage of 67.2%.
22.85 crore voters have chosen BJP, which is 33% more compared to 2014 election.
11.96 crore voters have chosen INC, which is 12% more compared to 2014 election.
The data file in *.CSV format can be downloaded from India 2019 Parliamentary Election
The below table shows the won candidate details for each parliamentary constituency.
The values are first sorted by state name & then by constituency name.
