Tamil Nadu electers and voters details for each election years
by theDataTalks . 31 Dec 2019The below bar chart has the details of electors & voters for each
election years.
- x-axis variable E-YOY (Election year on year)
- Y-axis variable Total Electors & Voters
Electors - Citizens who have eligibility to votes
Voters - Electors who had cast their votes
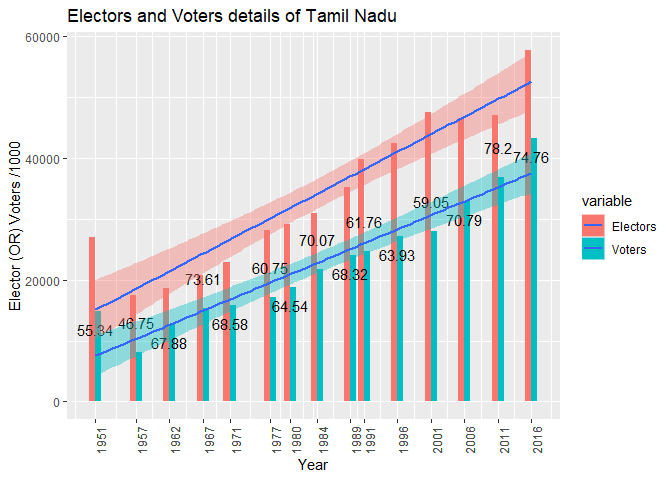
If you look at the bar chart (Electors/Voters), the average increase
in electors is calculated to 9.85% E-YoY (approximately), which is
approximately 3.5% lesser growth when compared to India’s average
elector’s growth of 13%. The average polling percentage of Tamil Nadu
falls at 67%, which is approximately 7% higher when compared to
India’s average polling percentage of 60%.
The above mentioned average values are calculated without considering
1951 data since there was a major change in constituencies in 1953.
The total voters in the bar chart for the year 1951 & 1957 were
back-calculated from reported polling percentage since Tamil Nadu had
dual member & single-member constituencies.
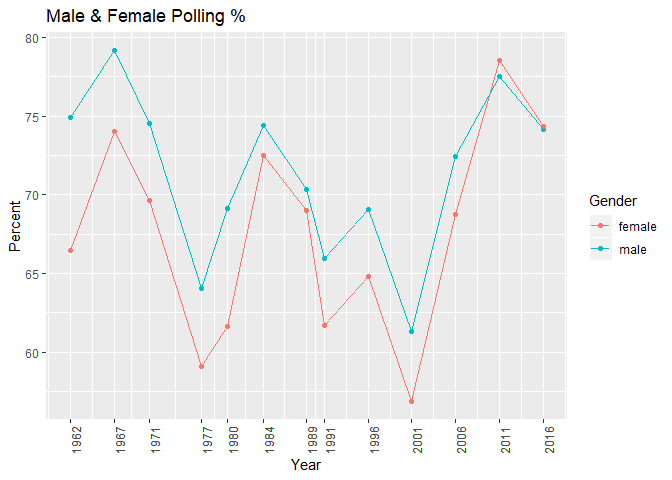
Male & Female voters:
1951 & 1957 male/female voting values are not available; hence we have
taken data from the year 1962.
The line chart clearly shows that the male & female voting percentage is
traveling parallel to each other.
Female voters in 2011 & 2016 were slightly more than male voters and it
shows women in Tamil Nadu have started showing more social
responsibility.
The average percentage of male voters is calculated to 71.31%, which
is 11.31% higher when compared to India’s average polling
percentage of 60%.
The average percentage of female voters is calculated to 67.48%,
which is 7.48% higher when compared to India’s average polling
percentage of 60%.
The data file in *.CSV format can be downloaded from Electors & Voters & Male, Female Voters