Let,
x1, x2, x3, x4, … xn are observations of a population and ‘n’ being the total number of observations, then
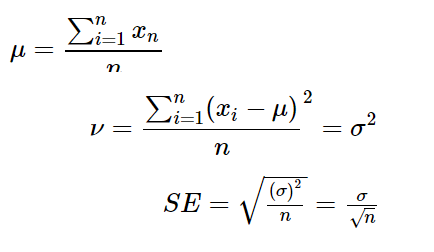
Population mean
x′=μ=nx1+x2+x3+.....+xn
Which is represented as
μ=n∑i=1nxn
Population vairance
ν=n(x1−μ)+(x2−μ)+(x3−μ)+....+(xn−μ)
Which is represented as
ν=n∑i=1n(xi−μ)2=σ2
Population standard deviation
σ=√ν=√σ2
Suppose n number of samples were taken from the above population & x_1, x_2, x_3, … x_n represents each sample then,
Mean of each samples: x1′,x2′,x3′,...xn′
Mean of Sample means:μ′=n∑i=1nxi′
Variance of sample means: ν′ = σ′2 = (n−1)∑i=1n(xi′−μ′)2
- Note we have used (n-1) as denominator for sample variance. We will talk about this in later sections.
Standard deviation of sample means = Standard deviation of Statistics = Standard Error(SE) =
σ′=√ν′=√(σ′)2
Mean
Average of a population.
Variance
The deviation for set of numbers which are spread out from the population mean. It is the expected squared deviation of a random variable from the population mean.
Standard Deviation
Amount of variability/spread for a population. Higher standard deviation for a population having higher spread.
Standard Error
The deviation between the sample mean and the population mean is called Standard error. Describes how far the sample mean is from the true population mean.
When we do not know the properties(mean, variance, etc.,) of true population, we can estimate them using sample sets.
As described above the Mean of all sample is taken as unbiased population mean estimator. And this is the best we can estimate.
Since the variance is dependent on mean,
Variance of samples {n(var(X1)+var(X2)+var(X3)....var(Xn) } = True Varience = σ2
Let X_1, X_2, X_3, … X_n are independent samples from a population, whos expected value is µ and variance σ². Then
X1, X2, X3, … Xn be the mean of each samples
Mean-of-Sample-meansX=nX1+X2+X3....XnVariance-of-all-Sample-Means =var(X)=var(nX1+X2+X3....Xn)=n21var(X1+X2+X3....Xn)=n21(var(X1)+var(X2)+var(X3)....var(Xn))=n21(nσ2)=nσ2
Standard deviation of all Sample Means = Standard deviation of Statistics = Standard Error(SE)
SE=√n(σ)2=√nσ