Data Source: https://www.who.int/
Date downloaded: 05-Apr-2020
Situation report 1 (21-Jan-2020) to 74 (04-Apr-2020)
First death due to Covid-19 was reported on 53rd day.
India total cases as on date: 2301 (World-1051635 & China-82802)
India total deaths as on date: 56 (World-56985 & China-3331)
India daily average new cases: 35 (World-13863 & China-950)
India daily average new deaths: 1 (World-756 & China-40)
Average Exponential Growth constant ‘k’ for total cases: 0.06/day (World-0.18/day & China 0.17/day)
Average Exponential Growth constant ‘k’ for total deaths: 0.0047/day (World-0.04/day & China 0.04/day)
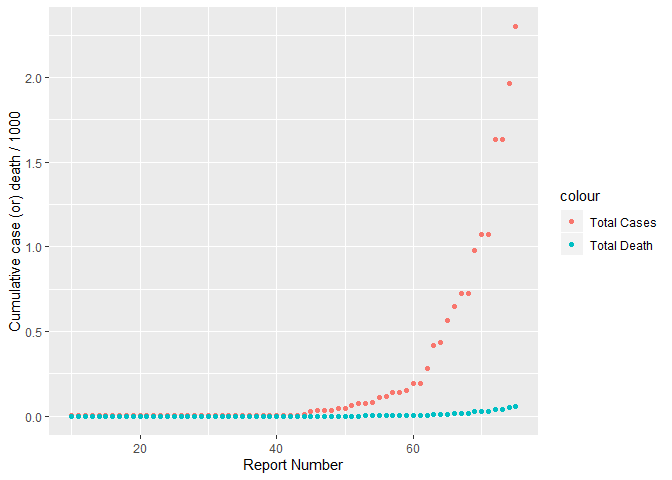
The below chart has
- x-axis - Report number (OR) Day number (Report number 1 starts on 21-Jan-2020)
- y-axis - Cumulative total death & total cases as of reported date
The below graph clearly shows that the Covid-19 spread is exponential.
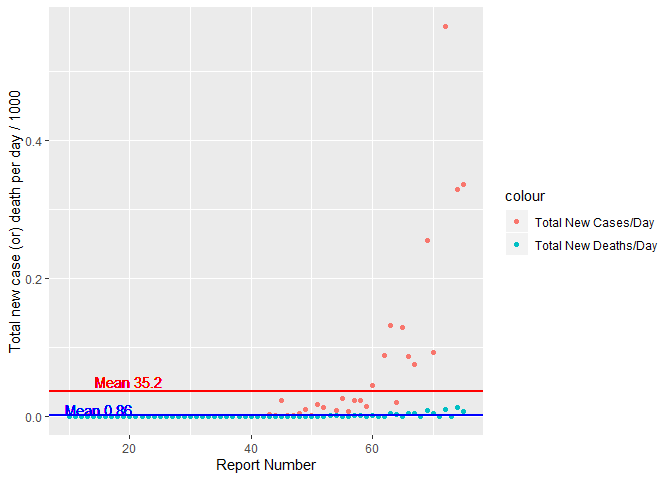
The below chart has
- x-axis - Report number (OR) Day number (Report number 1 starts on 21-Jan-2020)
- y-axis - Daily reported new deaths & cases
The below graph clearly shows that the Covid-19 daily new spread was initially stable and floating around a constant value. Now it is increasing exponentially.

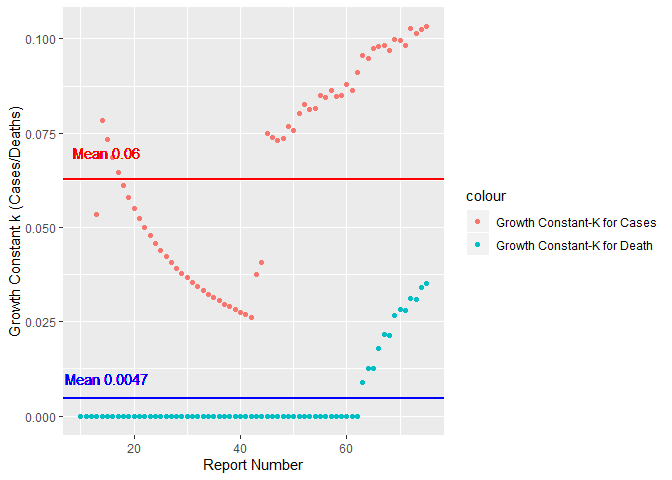
The below chart has
- x-axis - Report number (OR) Day number (Report number 1 starts on 21-Jan-2020)
- y-axis - Growth constant (K) for cases / deaths
Growth constant is calculated from the below general growth/decaying formula
A=Pekt
Initially the growth constant for cases was decaying and later it is
growing faster now.
Initially the growth constant for deaths was negligble and started
increasing now.
The summary of growth constant k for total cases
| Min. | 1st Qu. | Median | Mean | 3rd Qu. | Max. |
|---|---|---|---|---|---|
| 0.00000 | 0.03754 | 0.07086 | 0.06279 | 0.08600 | 0.10321 |
The summary of growth constant k for total deaths
| Min. | 1st Qu. | Median | Mean | 3rd Qu. | Max. |
|---|---|---|---|---|---|
| 0.000000 | 0.000000 | 0.000000 | 0.004681 | 0.000000 | 0.035187 |