
Tamil Nadu has 5 stations for continuous monitoring of air pollution. Out of which 4 stations are in Chennai and one station in Coimbatore. This document talks about PM2.5 (Particulate matter (PM) that have a diameter of fewer than 2.5 micrometers) level for one of the station named Alandur Bus Depot, Chennai.
Conclusions from the below analysis:
The PM2.5 data has 5.3% outliers and the details of outliers are given in the below analysis. After removing the outliers the PM2.5 level for Alandur falls under the category of “moderate” in summer season & monsoon1 season. It is slightly higher than “unhealthy for sensitive groups” in other seasons.
There is not much difference in PM2.5 level for weekend & weekday.
Data
Data Source: https://app.cpcbccr.com/
Date downloaded: 07-Jan-2020
Hourly data taken for this analysis 01-Oct-2017 to 30-Nov-2019
Total 18962 records & 4468 records are having “none” reading for PM2.5.
All “none” records removed for this analysis. The complete analysis was
done using R programming.
Below are the categories defined in 2012 EPA (United States Environmental Protection Agency) PM2.5 standard
Good - 0.0 – 12.0 µg/m3, 24-hour average
Moderate - 12.1 – 35.4 µg/m3, 24-hour average
Unhealthy for Sensitive Groups - 35.5 – 55.4 µg/m3, 24-hour average
Unhealthy - 55.5 – 150.4 µg/m3, 24-hour average
Very Unhealthy - 150.5 – 250.4 µg/m3, 24-hour average
Hazardous - 250.5 – 350.4 µg/m3, 24-hour average
Hazardous - 350.5 – 500 µg/m3, 24-hour average
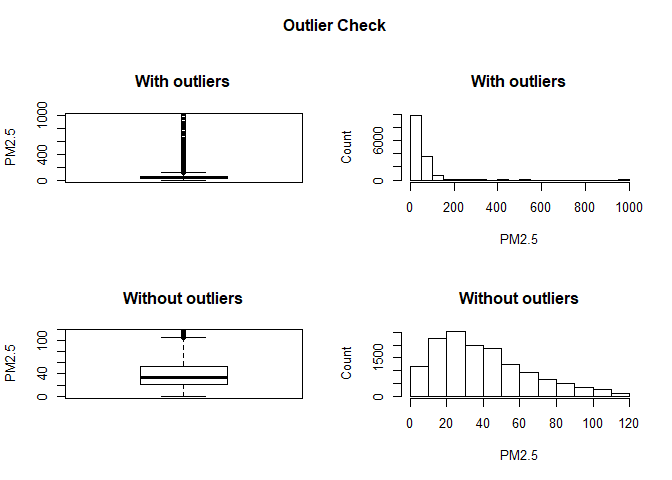
Details of Outliers:
An outlier is any datapoint that lies outside the 1.5 * inter quartile range (IQR). IQR is calculated as the distance between the 25th percentile and 75th percentile values for that variable. We have identified the outliers using R-command “BoxPlot”.
Below are the details of minimum, maximum, mean & median of identified outliers.
| Min. | 1st Qu. | Median | Mean | 3rd Qu. | Max. |
|---|---|---|---|---|---|
| 116.0 | 130.1 | 154.2 | 272.1 | 252.8 | 1000.0 |
The below box plot & bar chart shows the difference in data with & without outliers.
Outliers identified: 731
Proportion of outliers: 5.3%
Mean of the outliers: 272.11
Mean without removing outliers: 51.32
Mean after we remove outliers: 39.59
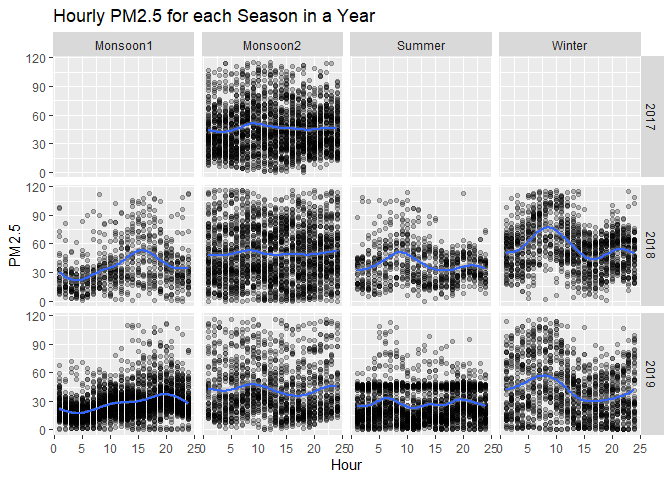
Yearly Mean/Average of Hourly PM2.5 for different Seasons:
All the below results were calculated after removing outliers from the source data. The first table shows the monthly average of PM2.5 & the second table shows the 24 hours average for each month.
| ## | 01 | 02 | 03 | 04 | 05 | 06 |
|---|---|---|---|---|---|---|
| ## month name | “Jan” | “Feb” | “Mar” | “Apr” | “May” | “Jun” |
| ## monthly_mean | “58.68” | “37.63” | “33.7” | “23.12” | “31.18” | “25.11” |
| ## | 07 | 08 | 09 | 10 | 11 | 12 |
|---|---|---|---|---|---|---|
| month name | “Jul” | “Aug” | “Sep” | “Oct” | “Nov” | “Dec” |
| monthly_mean | “27.77” | “26.32” | “33.19” | “38.85” | “46.42” | “57.96” |
| Day | 1 | 2 | 3 | 4 | 5 | 6 | 7 | 8 | 9 | 10 | 11 | 12 |
|---|---|---|---|---|---|---|---|---|---|---|---|---|
| 1 | 52.98 | 42.51 | 37.27 | 17.63 | 46.23 | 20.21 | 15.66 | 28.4 | 38.77 | 30.19 | 29.07 | 43.55 |
| 2 | 52.28 | 43.55 | 48.86 | 15.44 | 44.13 | 19.05 | 29.36 | 31.69 | 31.94 | 25.4 | 33.48 | 30.6 |
| 3 | 61 | 37.35 | 48.75 | 12.7 | 45.53 | 29.55 | 26.49 | 28.88 | 36.39 | 21.25 | 40.45 | 45.24 |
| 4 | 66.1 | 24.51 | 50.95 | 12.19 | 46.44 | 49.38 | 38.36 | 18.73 | 39.89 | 25.97 | 43.58 | 41.12 |
| 5 | 70.32 | 35.14 | 45.21 | 14.16 | 43.97 | 40.08 | 24.66 | 21.52 | 36.8 | 28.72 | 44.31 | 49.12 |
| 6 | 67.06 | 35.56 | 40.41 | 13.26 | 45.87 | 13.02 | 31.38 | 22.53 | 41.69 | 22.59 | 48.82 | 49.26 |
| 7 | 58.8 | 35.93 | 35.83 | 9.36 | 45.65 | 39.98 | 41 | 16.8 | 49.79 | 32.2 | 44.19 | 83.2 |
| 8 | 64.47 | 36.1 | 42.33 | 11.6 | 54.67 | NA | 45.59 | 21.06 | 36.17 | 32.6 | 45.96 | 90.24 |
| 9 | 61.39 | 27.34 | 35.04 | 14.41 | 32.49 | NA | 29.2 | 22.2 | 40.15 | 42.61 | 64.42 | 87.14 |
| 10 | 68.21 | 34.99 | 36.11 | 10.78 | NA | NA | 18.78 | 23.63 | 37.07 | 40.37 | 73.87 | 86.97 |
| 11 | 68.29 | 40.25 | 30.37 | 29.73 | 10.93 | NA | 23.59 | 19.03 | 36.97 | 28.56 | 65.88 | 85.04 |
| 12 | 61.96 | 40.98 | 28.35 | 21.36 | NA | NA | 37.09 | 21.63 | 33.95 | 35.78 | 61.87 | 65.9 |
| 13 | 58.22 | 60.08 | 29.9 | 20.68 | NA | 20.8 | 34.37 | 24.83 | 36.3 | 35.1 | 57.28 | 37.1 |
| 14 | 65.46 | 40.22 | 30.26 | 18.8 | 42.58 | NA | 33.8 | 24.44 | 34.83 | 37.94 | 41.7 | 49.72 |
| 15 | 73.58 | 56.58 | 32.33 | 17.59 | 24.93 | NA | 25.11 | 15.42 | 22.01 | 34.27 | 39.26 | 77.61 |
| 16 | 67.75 | 42.17 | 30.9 | 10.61 | 21.25 | NA | 28.6 | 21.71 | 23.78 | 30.57 | 47.08 | 42.46 |
| 17 | 70.55 | 47.05 | 32.93 | 9.05 | 23.2 | NA | 31.42 | 14.83 | 26.42 | 47.07 | 48.07 | 57.83 |
| 18 | 67.79 | 36.76 | 43.95 | 6.71 | 28.2 | NA | 30.45 | 11.35 | 24.91 | 49.6 | 31.82 | 61.1 |
| 19 | 61.67 | 23.66 | 39.34 | 5.14 | 23.32 | NA | 18.07 | 18.14 | 23.09 | 53.75 | 33.76 | 37.94 |
| 20 | 64.51 | 33.75 | 45.87 | 9.08 | 14.59 | 32.25 | 20.56 | 23.7 | 40.68 | 53.36 | 32.47 | 52.28 |
| 21 | 69.31 | 42.9 | 36.43 | 13.84 | 15.12 | 36.13 | 19.75 | 34.46 | 38.96 | 51.96 | 19.64 | 42.35 |
| 22 | 58.65 | 32.4 | 28.42 | 31.23 | 15.13 | 25.32 | 24.62 | 37.28 | 40.91 | 40.81 | 32.71 | 50.28 |
| 23 | 39.61 | 32.92 | 29.14 | 45.56 | 18.3 | 25.51 | 40.04 | 32.76 | 35.77 | 65.82 | 63.62 | 52.6 |
| 24 | 46.57 | 33.58 | 27.31 | 45.77 | 22.23 | 17.25 | 22.62 | 24.81 | 27.66 | 57.25 | 73.51 | 60.42 |
| 25 | 52.81 | 30.93 | 26.65 | 45.42 | 21.49 | 21.18 | 27.55 | 30.78 | 24.75 | 48.1 | 45.56 | 71.05 |
| 26 | 39.03 | 28.91 | 27.63 | 45.33 | 23.96 | 28.68 | 17.86 | 24.3 | 30.13 | 50.98 | 55.89 | 77.88 |
| 27 | 43.95 | 35.31 | 26.75 | 45.75 | 22.53 | 26.47 | 20.52 | 30.66 | 20.19 | 52.32 | 48.19 | 75.65 |
| 28 | 44.16 | 45.97 | 20.38 | 44.44 | 51.21 | 30.78 | 27.24 | 29.77 | 30.87 | 52.83 | 51.65 | 55.61 |
| 29 | 48.88 | NA | 19.22 | 46.21 | 27.54 | 12.41 | 21.49 | 36.25 | 29.43 | 39.75 | 41.76 | 57.17 |
| 30 | 48.21 | NA | 15.26 | 44.17 | 32.73 | 1 | 29.19 | 38.09 | 20.58 | 19.67 | 36.71 | 58.84 |
| 31 | 48.65 | NA | 23.7 | NA | 25.06 | NA | 28.06 | 34.68 | NA | 33.92 | NA | 51.37 |
Season classification:
- Jan & Feb - Winter
- Mar, Apr & May - Summer
- Jun, Jul, Aug & Sep - Monsoon1
- Oct, Nov, Dec - Monsoon2
The below plot gird shows the year-wise details of hourly PM2.5 levels for different seasons.The blue line across each plot indicates Smoothed conditional means.
From the below data, it is very clear that the pollution levels are less in summer compared to other seasons.
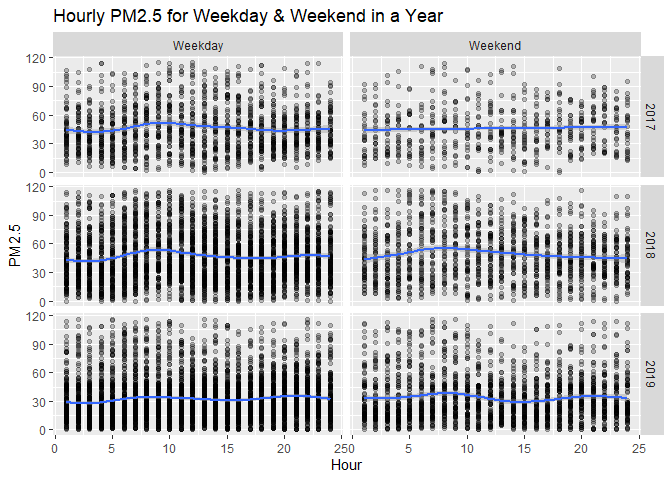
Mean/Average of Hourly PM2.5 for Weekdays & Weekends
The below plot grid shows the hourly PM2.5 levels for weekdays and weekends. The blue line across each plot indicates Smoothed conditional means.
The below plot shows that, there is not much difference in PM2.5 levels for weekdays & weekends.
The data file in *.CSV format can be downloaded from Alandur-Air Pollution Data