World Covid-19 Corona virus data
by theDataTalks . 05 Apr 2020Data Source: https://www.who.int/
Date downloaded: 05-Apr-2020
Situation report 1 (21-Jan-2020) to 75 (04-Apr-2020)
World total cases as on date: 1051635
World total deaths as on date: 56985
World daily average new cases: 13863
World daily average new deaths: 756
Average Exponential Growth constant ‘k’ for total cases: 0.18/day
Average Exponential Growth constant ‘k’ for total deaths: 0.04/day
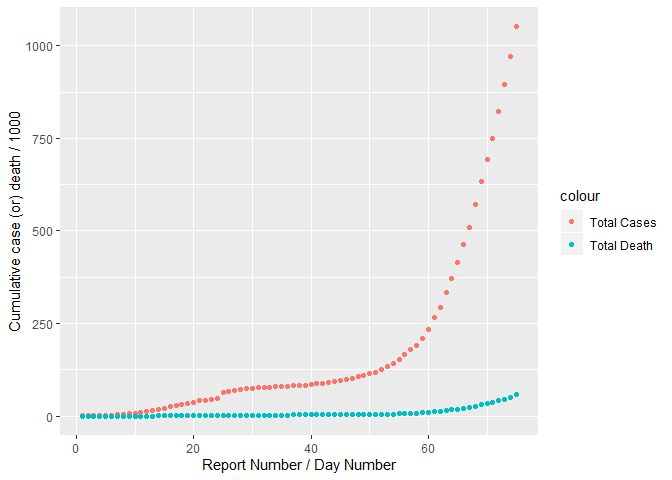
The below chart has
- x-axis - Report number (OR) Day number (Report number 1 starts on
21-Jan-2020) - y-axis - Cumulative total deaths & total cases as on reported date
The below graph clearly shows that the Covid-19 spread is exponential.
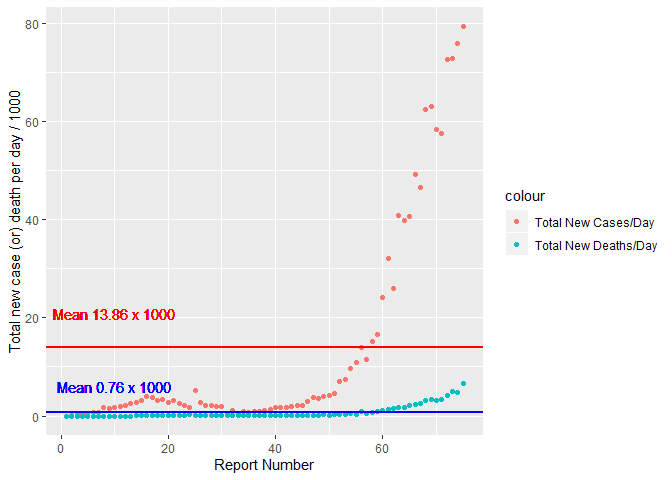
The below chart has
- x-axis - Report number (OR) Day number (Report number 1 starts on
21-Jan-2020) - y-axis - Daily reported new deaths & cases
The below graph clearly shows that the Covid-19 daily new spread
is exponential.
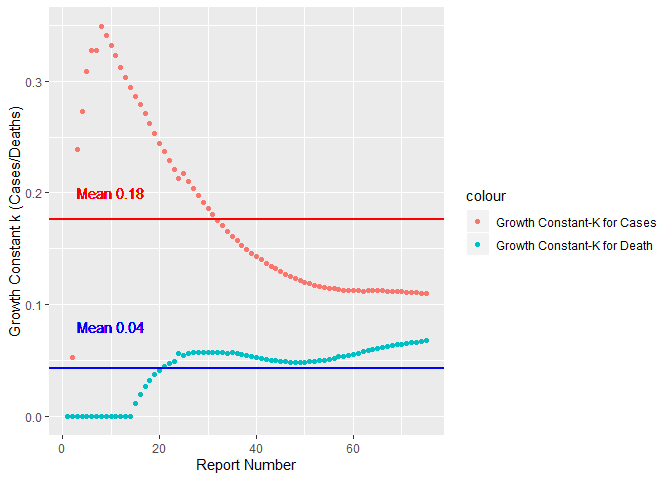
The below chart has
- x-axis - Report number (OR) Day number (Report number 1 starts on
21-Jan-2020) - y-axis - Growth constant (K) for cases / deaths
Growth constant is calculated from the below general growth/decaying
formula
A=Pekt
The growth constant for cases was decaying and stabilizing to a value
around 0.11.
The growth constant for deaths was floating around a constant value and
started increasing slowly.
The summary of growth constant k for total cases
| Min. | 1st Qu. | Median | Mean | 3rd Qu. | Max. |
|---|---|---|---|---|---|
| 0.0000 | 0.1123 | 0.1428 | 0.1759 | 0.2326 | 0.3488 |
The summary of growth constant k for total deaths
| Min. | 1st Qu. | Median | Mean | 3rd Qu. | Max. |
|---|---|---|---|---|---|
| 0.00000 | 0.03907 | 0.05139 | 0.04265 | 0.05709 | 0.06745 |